PV-System, Performance
De PV-system comprises a compact array on the roof aimed East (= +115 degrees from North), in combination with a distributed setup on the flat roof, aimed South (= +205 degrees from North).
What performance under the influence of 'environment'?
Expected effiency per group is dependent on nominal power, viewing direction and 'environment'.
The first 2 aspects can be found in the table, whale the 3rd aspect is detemined by the trees & buildings in de vicinity, by actual weather and by the time of the year.
The readout by the various loggers allows to check each group in detail related to performance over the year.
In 2016 en 2017 no changes to the configuration, in 2018 minor upgrade, and 2019 unchanged, therefore good basis for comparison (although in February 2016 the STECA1&580Wp was out and end of 2019 a logger time-out).
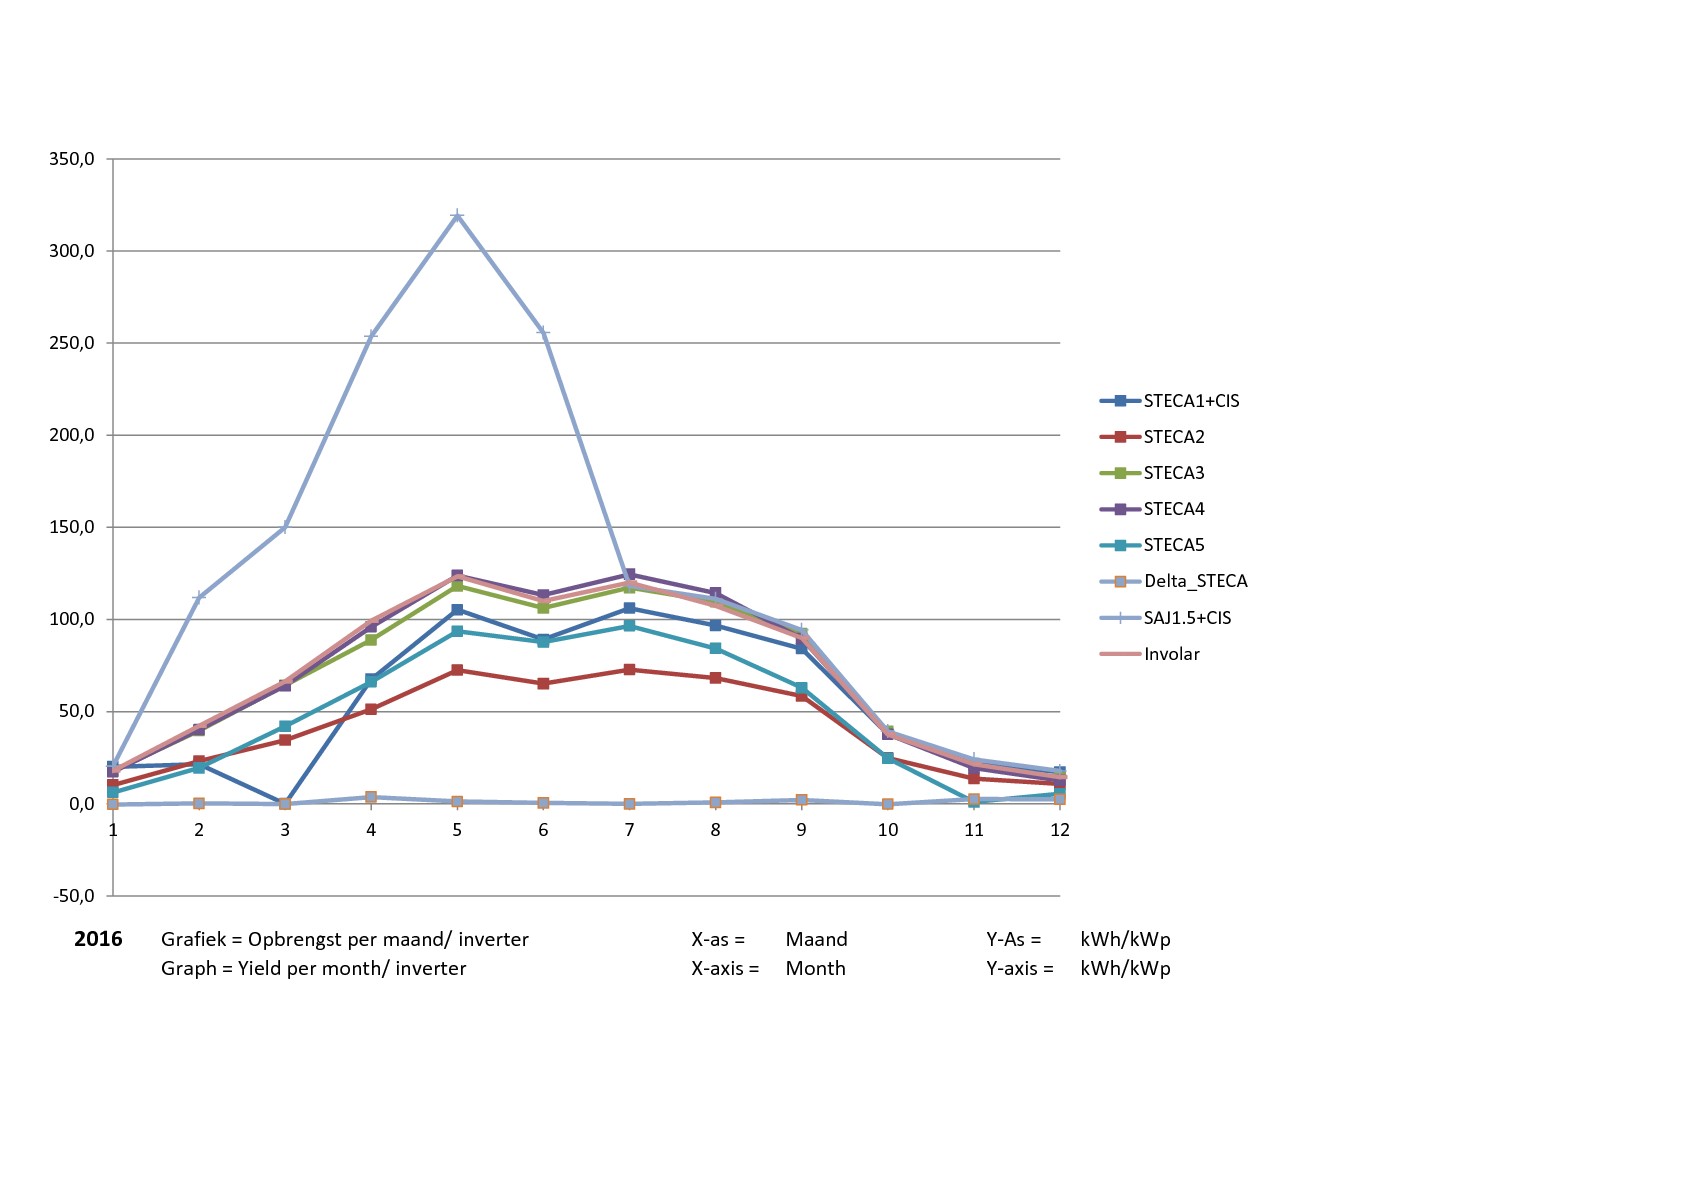
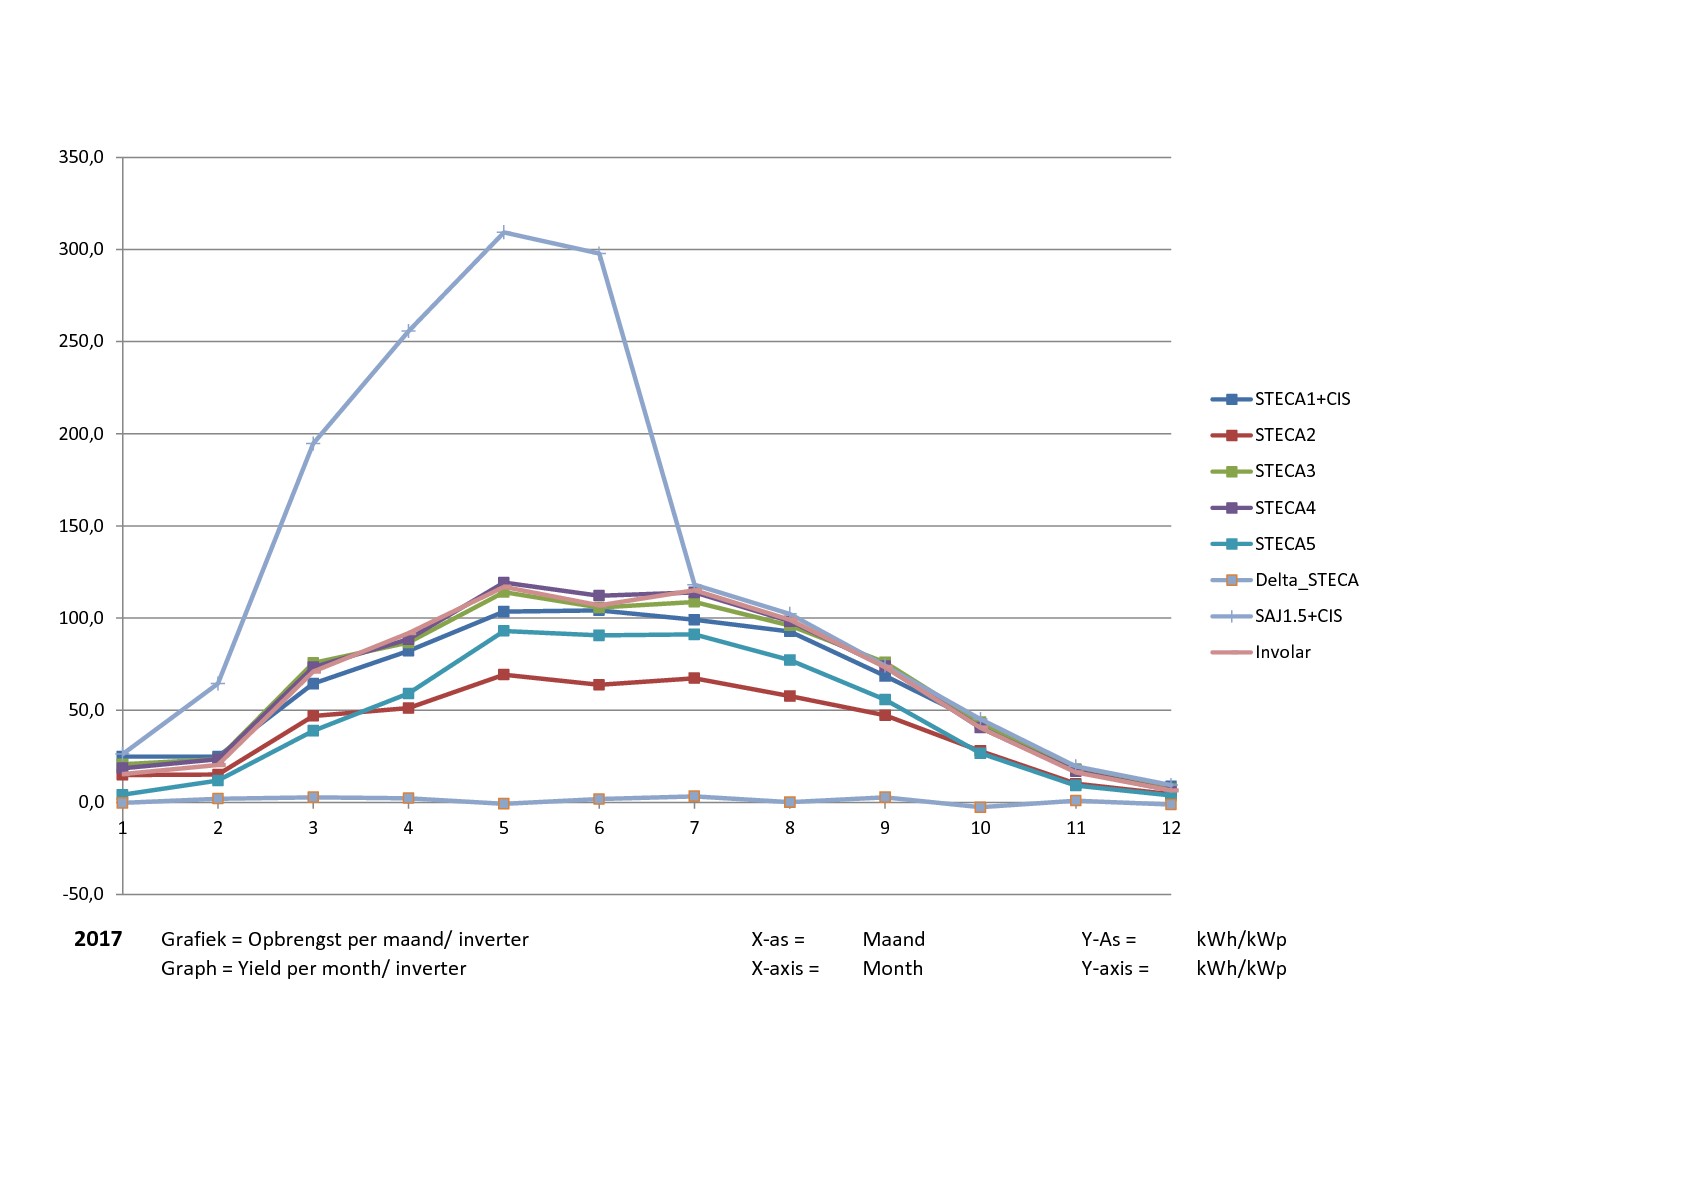
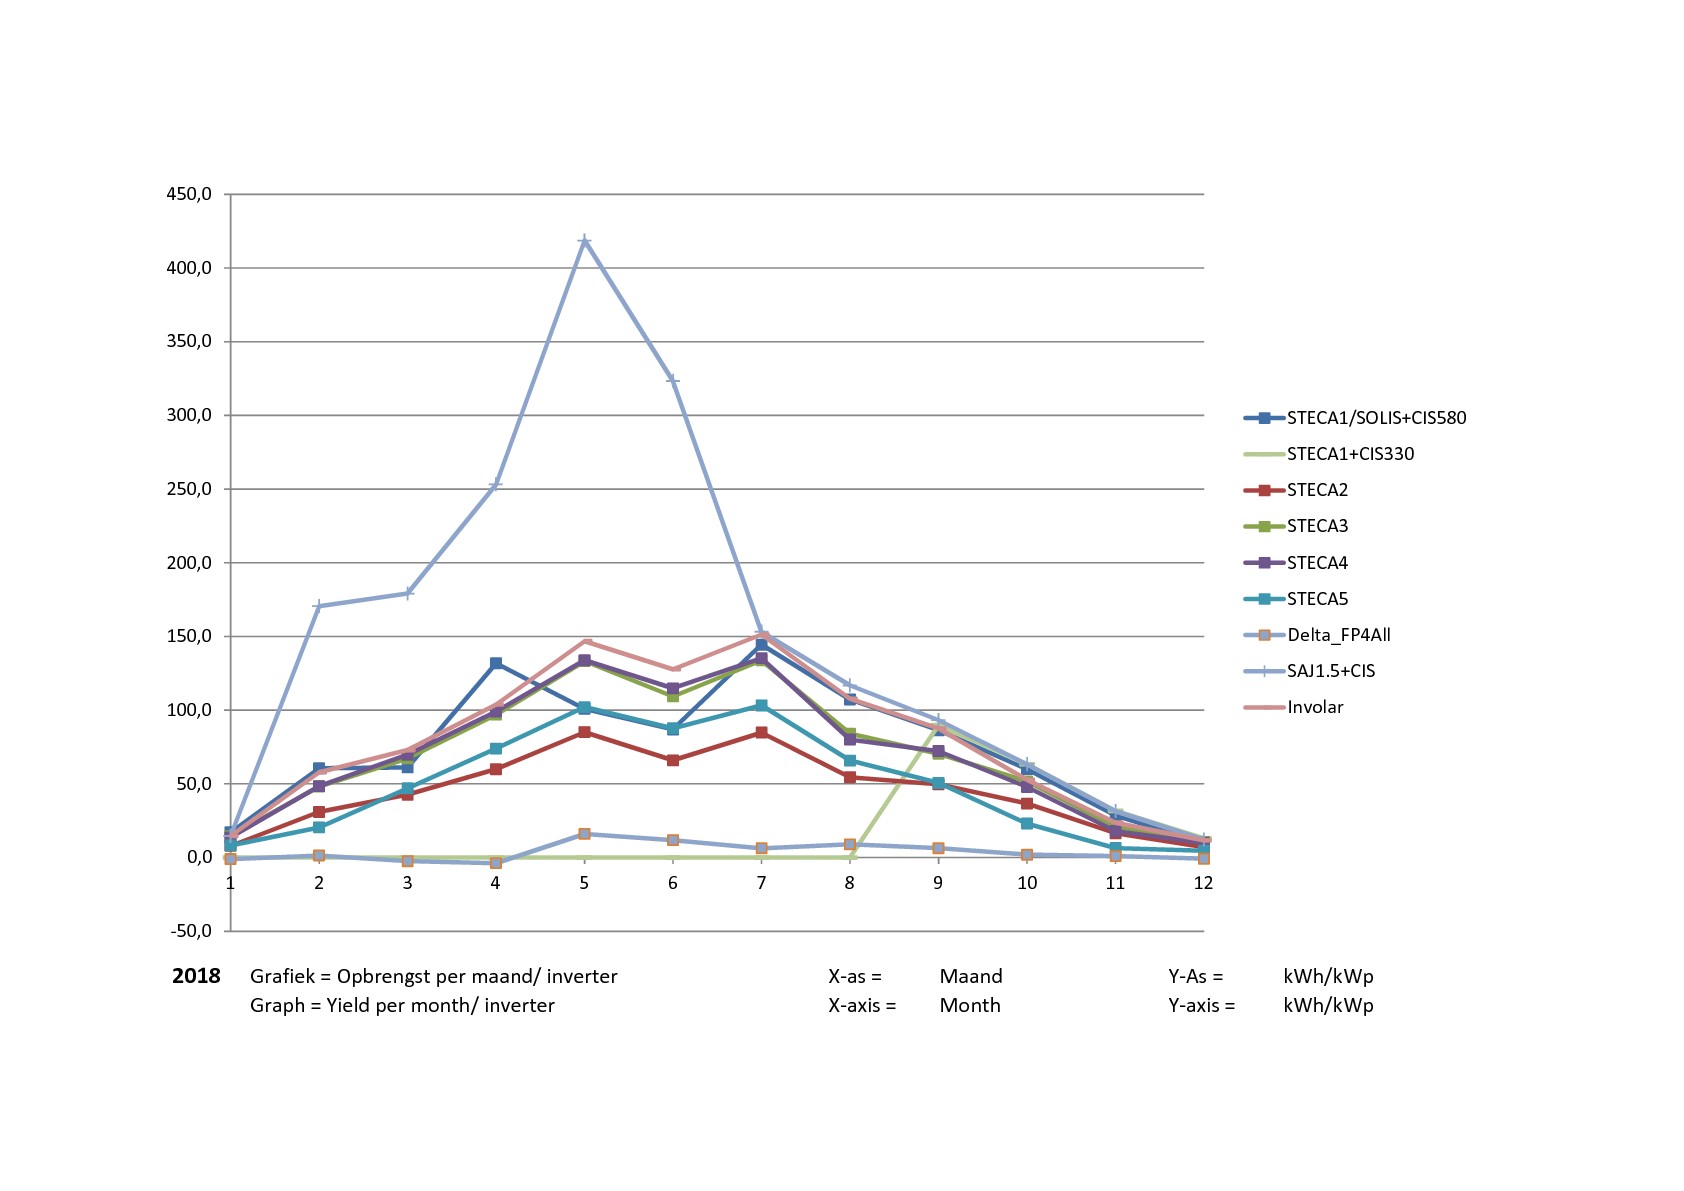
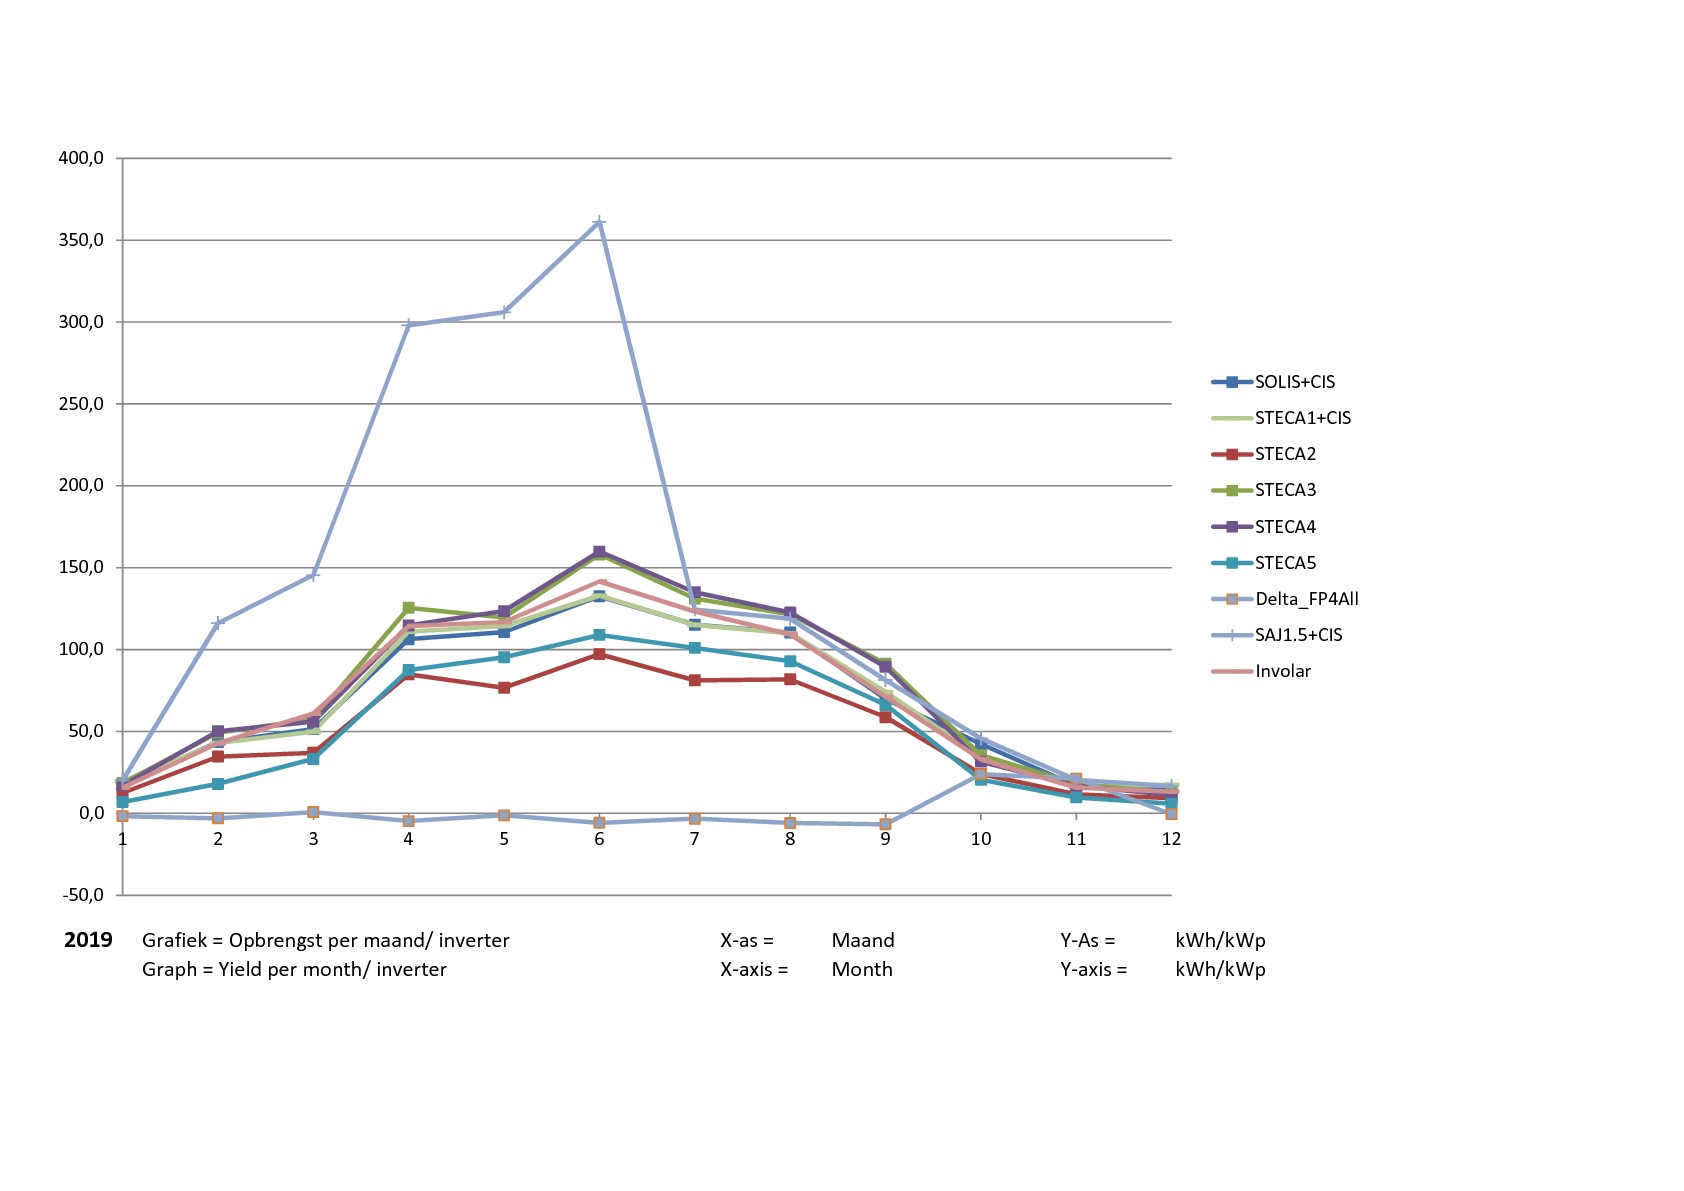
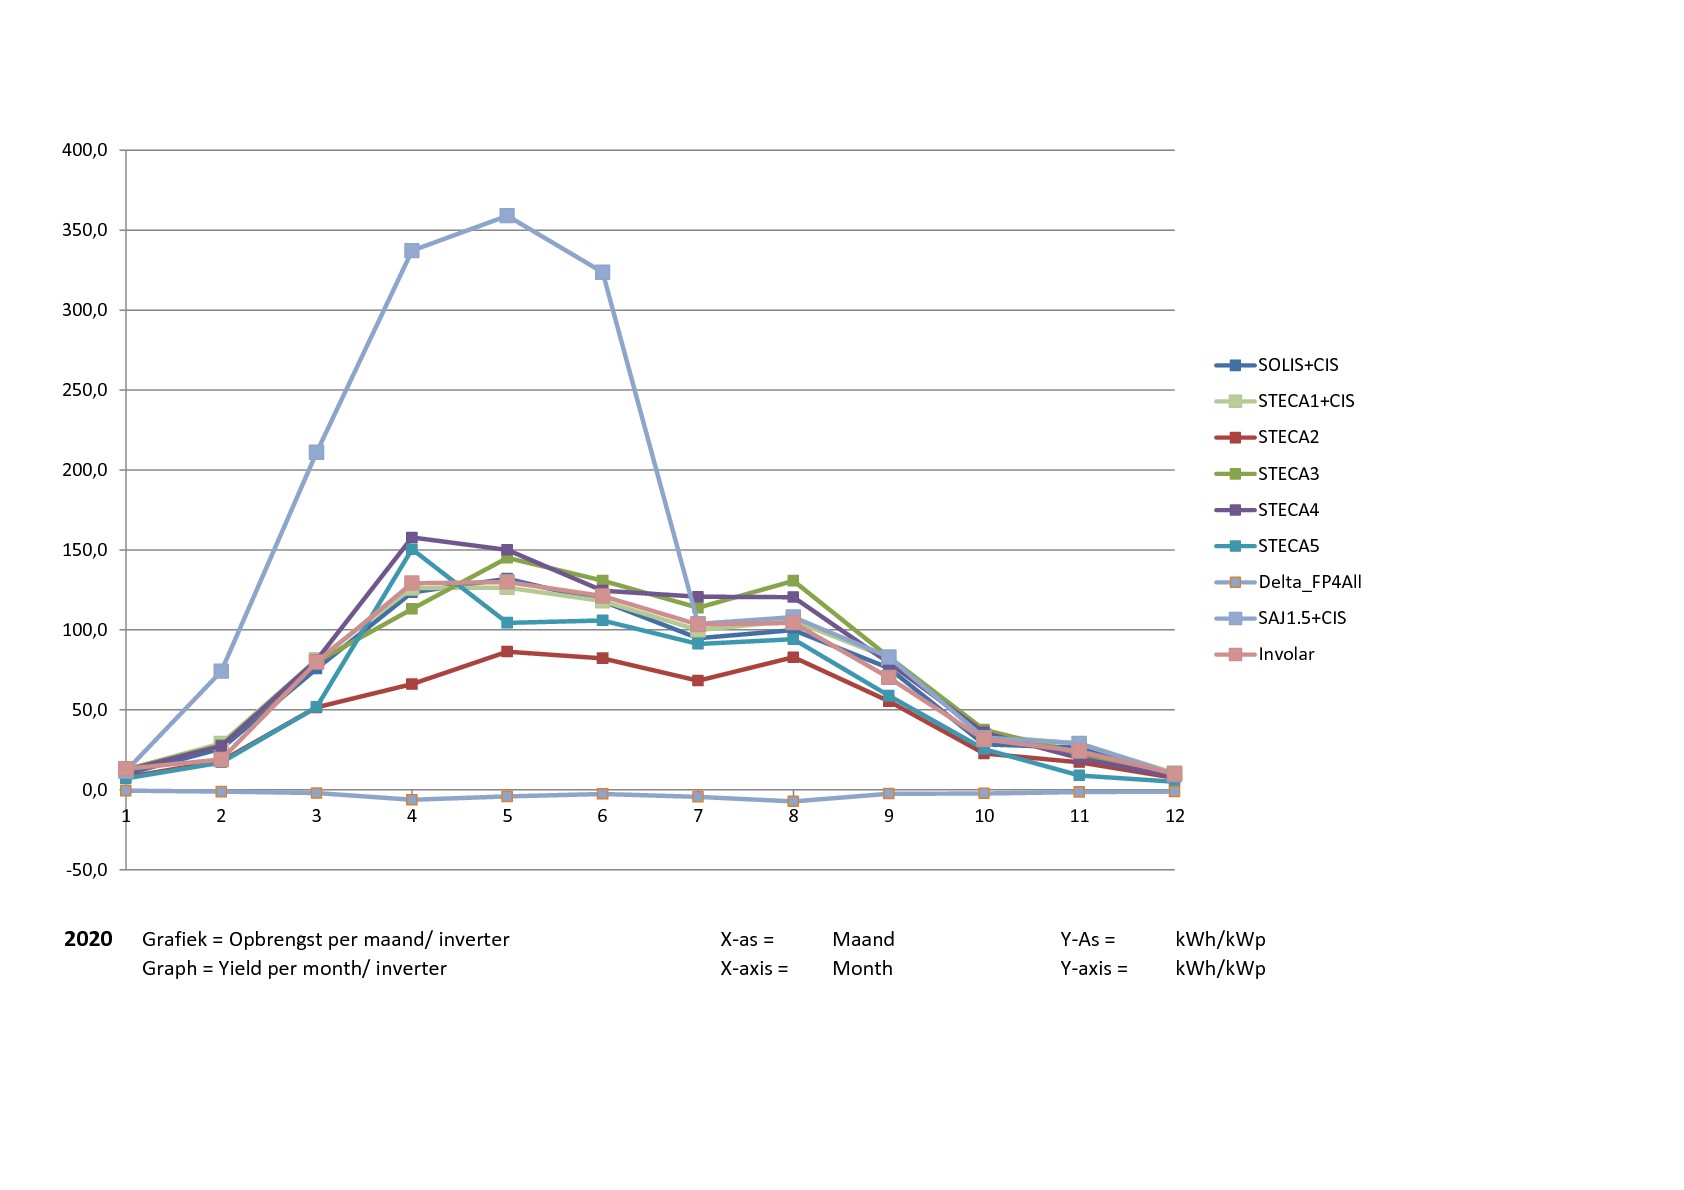
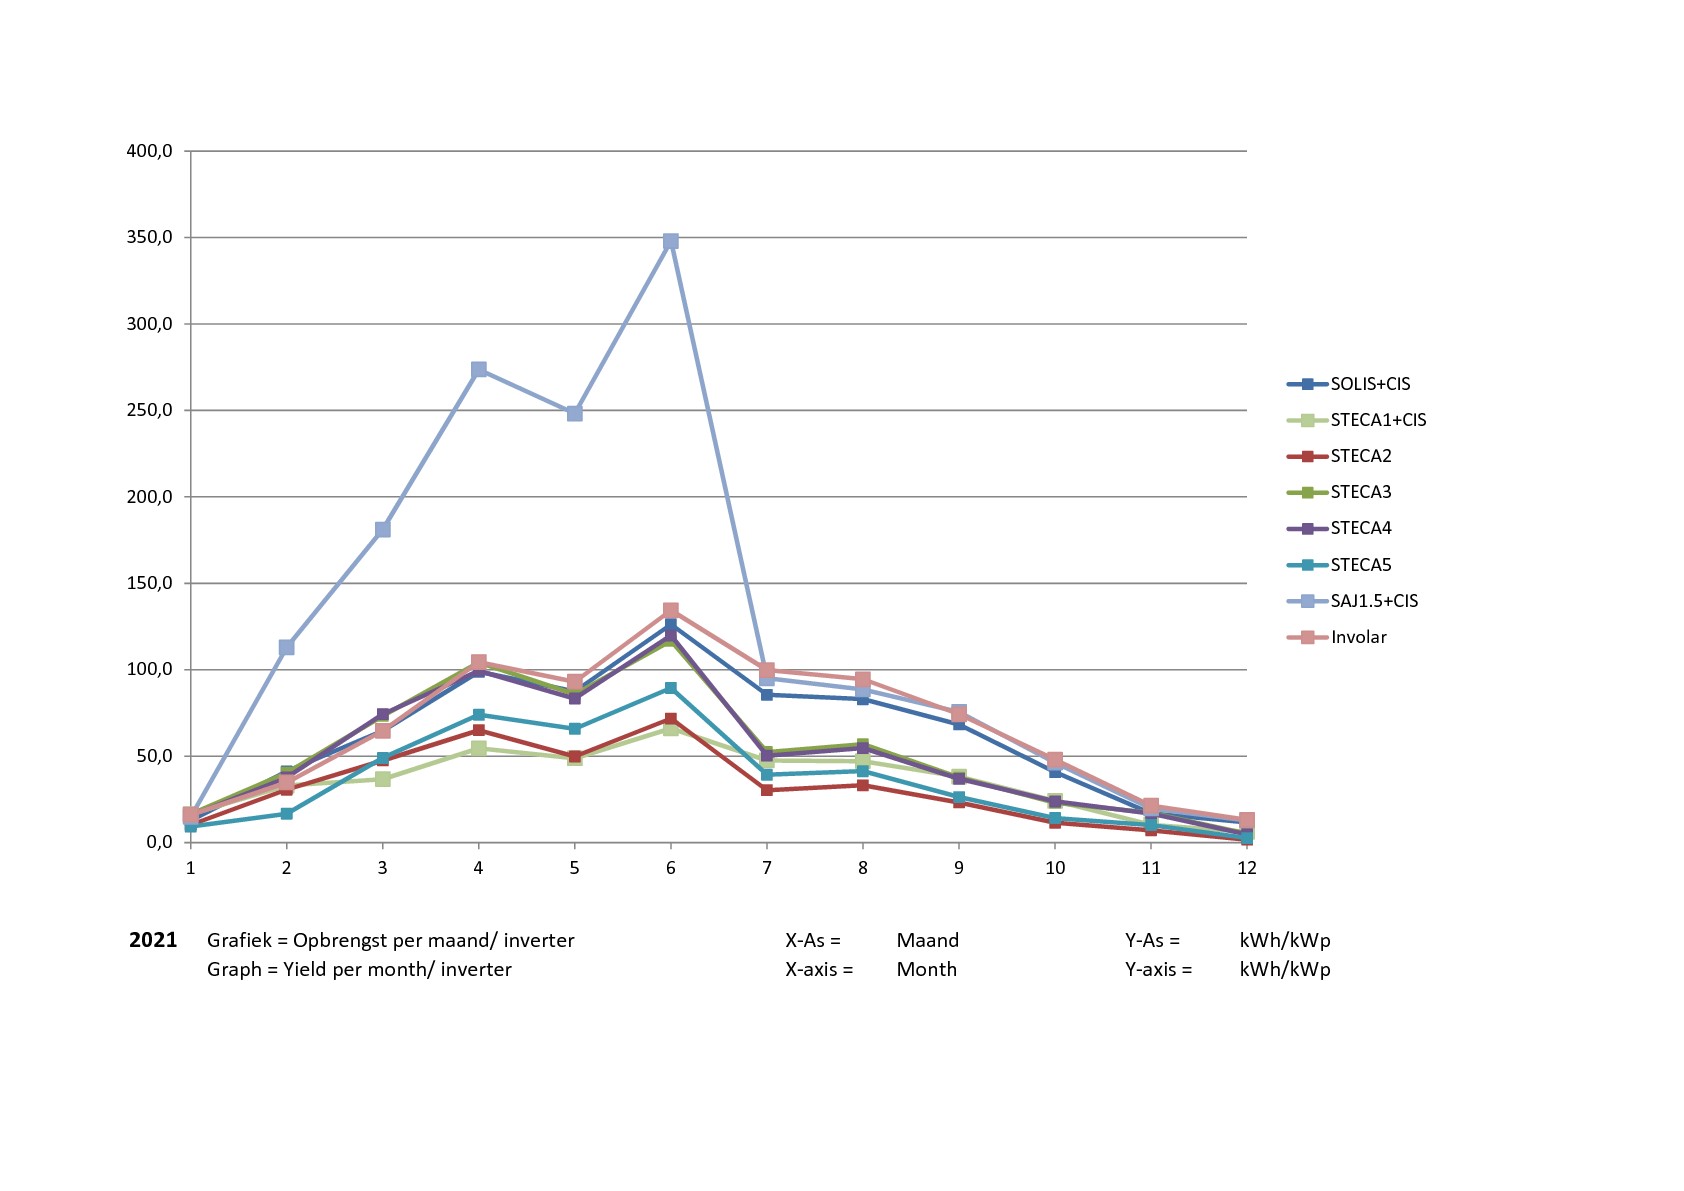
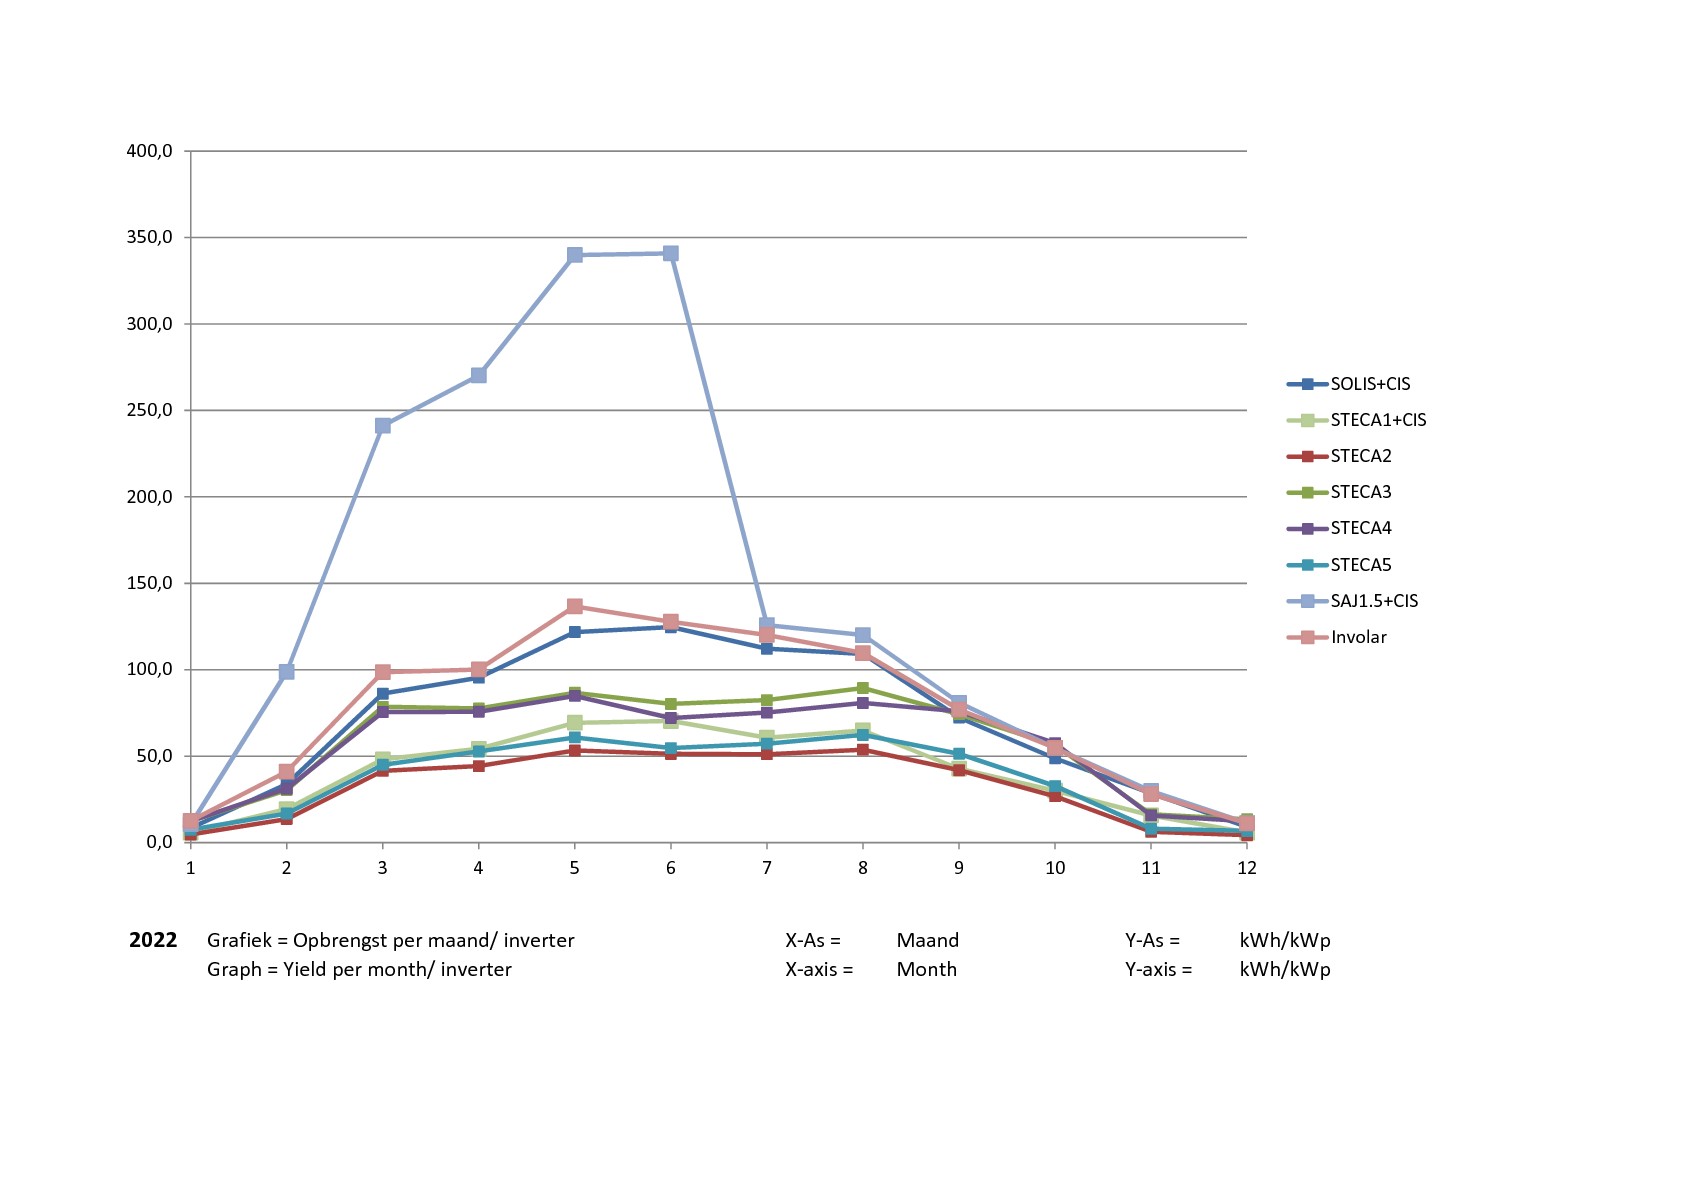
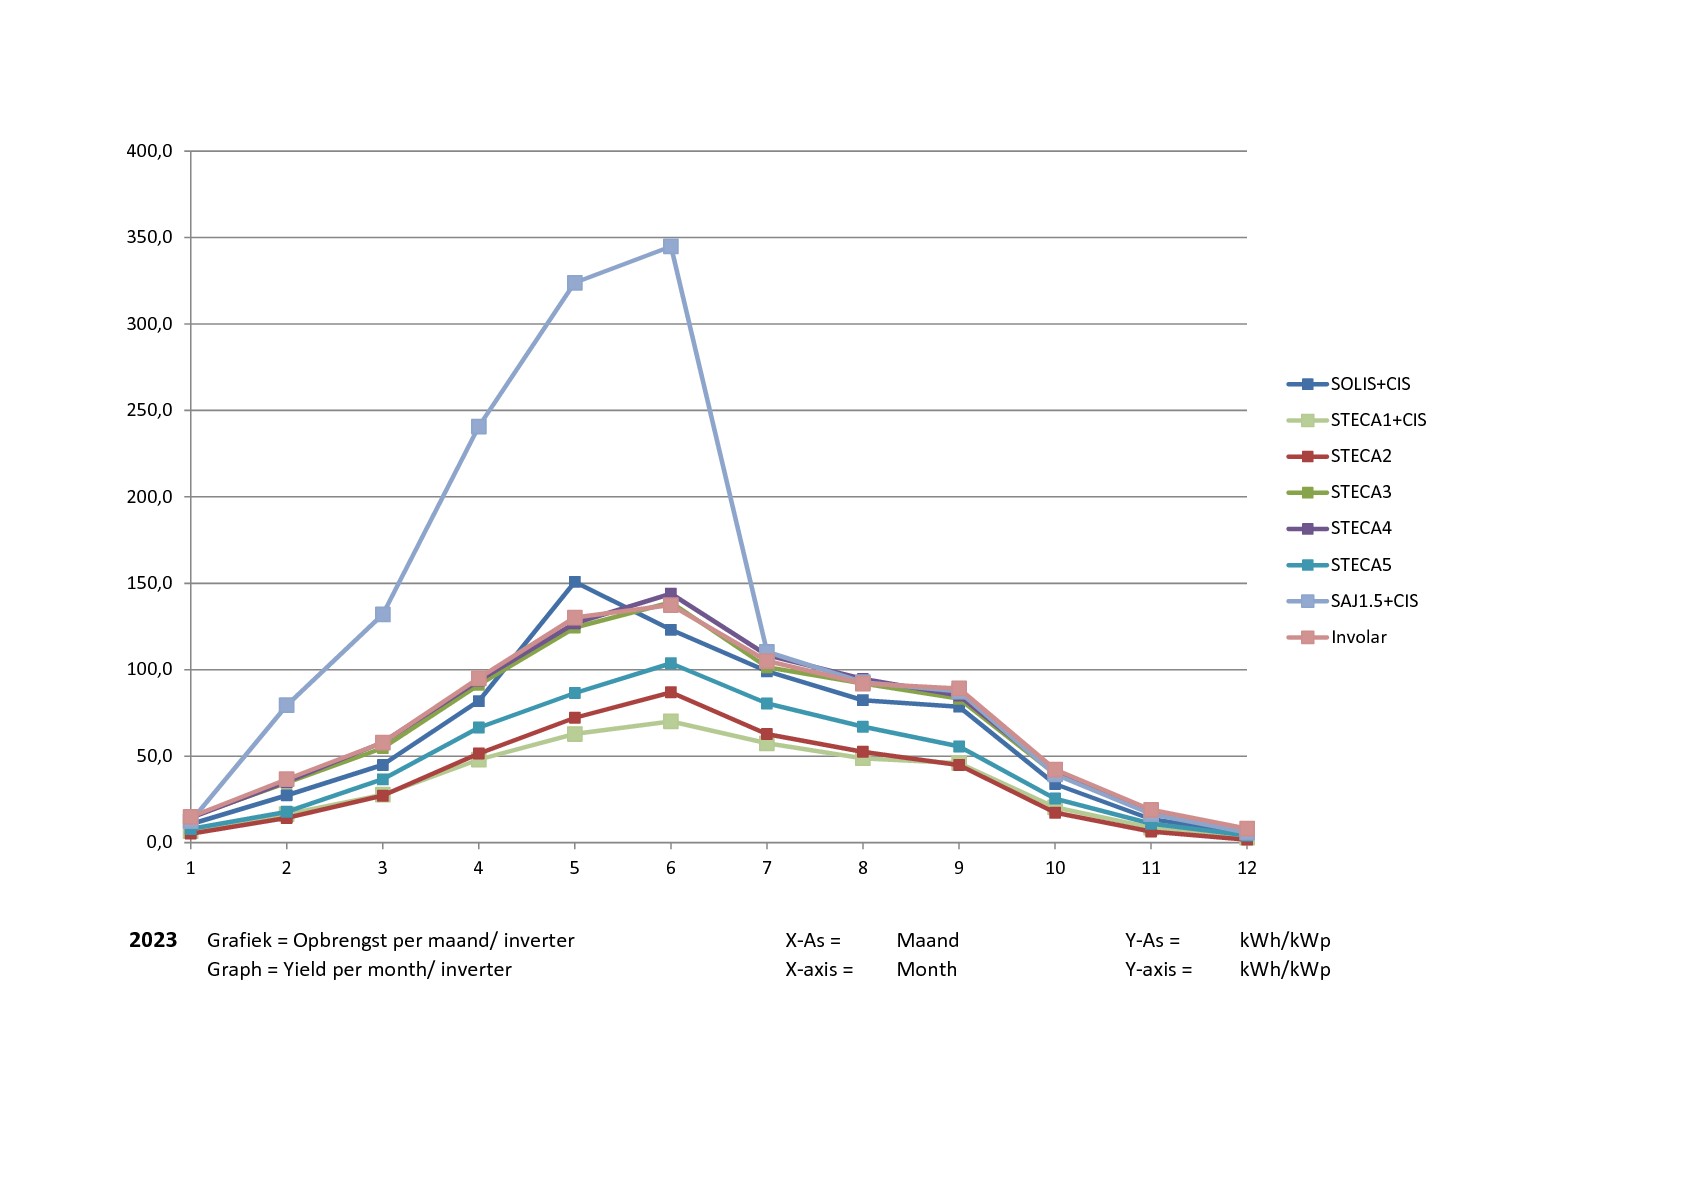
The graphs below show the performance per group/inverter per year.
For an 'honest' comparison the performance per group/inverter is expressed in Wh/Wp, which is relative energy (Wh) vs. installed power (Wp).
Due to this calculatory correction the difference in absolute size per group has no effect.
Visible effects
- the Involars with their panels fully exposed set the standard.
- STECA3 and STECA4 follow till mid-May 2021, and then drop due to the increased shadows from neighbours' roof
- SAJ1.5+CIS-panels exceeds expectation till july:
- cool CIS-panels in combination with light-soaking have performance above spec
- warm/hot CIS-panels perform according to spec, approaching the performance of the Involars
- the inverter makes good use of the panels' output.
- STECA1+CIS-panels and Solis+CIS-panels however do not take any advantage of the cool&light period, and lag in the other period.
Probably to be attributed to less-than-optimal match of panels and inverter, and due to shadows.
Solis+CIS-panels follows the line of the Involars.
STECA1+CIS-panels is in line with the other STECAs. - STECA2 in Group C further back on the flat roof clearly is situated unfavourably with much shadow in morning and afternoon.
- STECA5 in Group D also halfway the flat roof is not well performing either, but performs better than STECA2.
Because (till september 2021) the panels of Groups C and D lay in alternating sequence, the difference in performance seems an effect of different elevation of the panels (Group D = 10 degrees vs Group C =30 degrees).
But due to the extend of the combined array it might be that uneven & mutual shadows also have negative effects on both groups, because a shadow on 1 panel has effect on the next panels in that string.
The regrouping in September 2021 puts the performance of STECA2 and STECA5 nearer to STECA1, STECA3 and STECA4.
In the year-statistics this difference over 2016, 2017 and 2019 is <2%, for 2020 <4% and for 2018 <5%.
For other, comparable system configuration in the vicinity the difference is <3%, respectively for 2018 and 2019 <5%.
For 2021 the difference seems to increase [not further tracked due to changes in logging for the 'other system'].
Intermediate results/Challenges:
- Is it possible to get performance from STECA1+CIS-panels and Solis+CIS-panels at same level as SAJ+CIS-panels?
Does not seem possible without replacement of the inverters => cost with little gain = not a option
- How to boost the groups with STECA2&5 to comparable performance as STECA3&4?
In 2021 and 2022 still an actual challenge without clear results. - Additional challenge is to bring & keep the total output/year at pre-2021-level, or improve.
- possibly it helps to regroup the panels of STECA2&5 into 2 compact setups according to this revised layout
- = in practise the groups C and D will have better illumination plus better ventilation under both groups
- = the PVGIS-calculations do not show real energy-advantage and still excluding the changed shadow from the neighbours
- = minimal cost for this change, because all effort is recycling and DIY-assembly
- => results are ambiguous
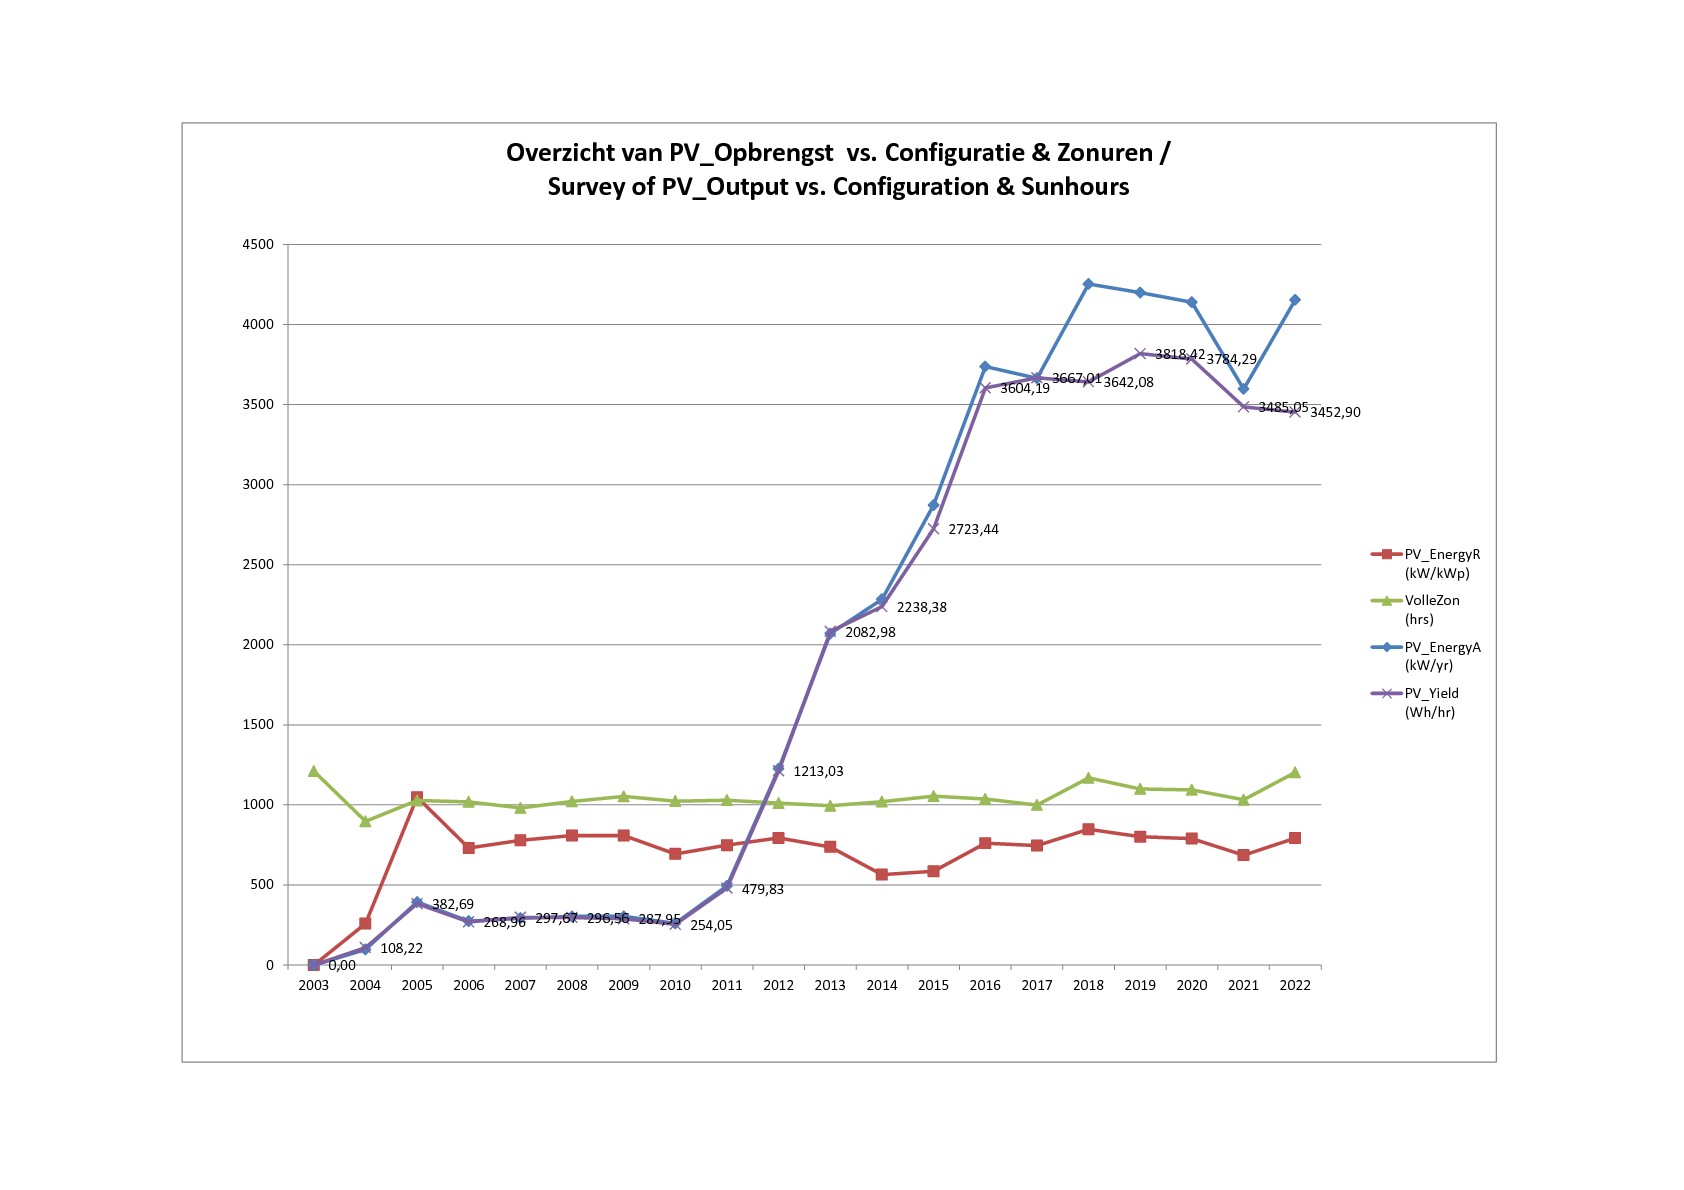
but obviously the absolute capacity of the panels always has effect on the total yield of the configuration.
The graph at left shows the development of the PV_Yield since the start at this location,
- in relation to the expansion of the configuration (but 'relatively' with PV_PwrR = Relative PV_Energy per year) and
- in relation to the amount of illumination (VolleZon = amount of sunhours per year, and Wh/hr = average PV_Energy per sunhour).
'Numbers tell a story:'
- in 2004 only 4 months of initial production (from 1 April till 1 Augustus) till breakdown of inverter PSI300
- in 2005 12 months of production with new inverter PSI300 without any shade from neighbouring trees => PwrR is maximal!
- 2006 ~ 2011 the trees grow with increasing shades over the panels => reduction of PwrR
- 2011 ~ 2015, more panels, but not optimally located => limited improvement of PwrR
- 2015 ~ 2018, expansion with panels on the roof of the house & optimalisation of combinations
- 2018 ~ 2021, only optimalisation of the combinations
- mid may 2021, neighbours expand roof, causing more shadow
- mid september 2021, change of the setups for groups C and D, and also tree cutting by the neighbours
- 2022 & 2023, seems to show revival, or just influence of that year's weather?
Unfortunately till now not (yet) clear gain for STECA2&STECA5, but (contrarily) loss for STECA1, STECA3&STECA4.
Additional (Dutch) PV-information
Sitemap/ Jumplist voor deze website, incl. links to english versions of pages
Copyright © 2013-2023 T4S
Samenvatting voor Rechten & Verantwoordelijkheden / Summary for Rights & Liabilities
