Air Quality - Gas contents - 1
This webpage is a version for Trial & Test, for Gas-Info related to Air Quality!!!!
More a discussion of concepts and of first experiments than description of a completed realisation.
This webpage comprises
Measurement of Gas
For Air Quality Dust and Gas interrelate.
On ground level especially the gasses NO2 en O3.
Local measurement of NO2-gehalte is a prime requirement, in which interaction with O3-contents and other air charateristics such as temperature and humidity should be recognized.
Many uncertain aspects related to practical realisation.
Aiming at a configuration which is and effective, and simple to set & control and financially affordable, a stepwise approach like for Dust seems approriate:
-
 As start a basic configuration which is rather broadband, with gas sensors which in (limited) quality and (limited) sensitivity are compatible with the dust-sensor GP2Y10
SGS in it's catalogue has sensors MiCS2714 and MiCS6814, already implemented by others in break-outs to be installed in suitable housing providing good gas flow.
Type MiCS2714 only reports NO2-level, and might serve as quickstart 'gasset' in combination with the ADC of an ESP8266.
Type MiCS6814 reports gas level divided in 3 signals for CO, NH3 and NO2, as a kind of spectrum-survey aimed at
"detection of pollution from automobile exhausts and for agricultural/industrial odors" [quote from datasheet].
-
 Next level with a 'better' configuration for more accurate and more 'deep'investigation of specific segments
Alphasense has in it's catalogue the sensors NO2-B43F and OX-B431 for measurement of NO2 and O3
Besides the sensors they can provide compatible interfaces, both mechanical and electronical.
- Speed of the airflow over the sensors must be constant, because otherwise the measurement is affected.
This requirement implies that the fan must have stabilized/controlled power supply.
- As reference for the gas measurements, the air flowing over the sensors also must be well measured for temperature and humidity.
This requirement implies that the T&H-sensors must be in the air flow close before or close behind the gas-sensors, preferably in a common tube/canal.
- The characteristics of the MiCS6814 are defined for an environment of 25C&50%RH.
The definition for the Alphasense' sensors has a wider operational T&H-range, but RIVM's testreport hints at sensitivity for moisture,
For measurement of gas-content the use of Dry/hot air seems therefore a better basis than the direct, wet/cold outdoors air:
requiring additional attention because a setup for heating/drying should have good stability and simple reproduction for alignment between the measuring setups, enabling honest comparison between comparable stations ......
-
 The processing of the sensorsignals anyway requires additional interfaces (incl. A/D-converters) as well as functions for calibration.
- As a 1st processing stage and for communication an ESP8266 or a Raspberry may be suitable.
- Related to calibration especially an easy availability of good references is a 'hot' issue.
The gas sensors mentioned above have been evaluated by RIVM, and are being applied in various setups.
A stepwise approach takes care of several aspects:
- the experience for outdoor gas measurement in the perspective of Citizen Science is still limited, and with the experimental basic configuration
- a physical setup can be developed which has the sensors well located in the air flow
- experience can be collected related to occuring outdoor phenomena
[which may confirm the basic configuration in a role as 'gasalarm-alerter']
- experiments may lead to a functioning approach for local or remote calibration
- initial investment can be limited
- also the 'better' configuration needs further developement, because
- implementation of it's sensors requires a rather extensive infrastructure [= compatible, gas-neutral!! housing with controlled air flow, interfaces and software]
- periodic calibration is critical and cannot be realised at user's location.
This document explains why it is difficult/impractical to expect calibration outside a laboratory.
- variation between sensors, degradation/shift of characteristics and limited life cycle of the sensors
- components & realisation still are rather expensive (at least for Citizen Science)
Conclusion: time required for getting more experience and for further development .......
Until a setup has been developed and tested, which has high quality&reliability at an acceptable price-level, simple(r) placeholders and some information from 'elsewhere' have to be applied, like Copernicus Atmosphere Monitoring System.
E.g. the presently online Ozone-information from DarkSky/NASA in this page is only valid for higher layers (~stratosphere),
with meaning in relation to attenuation in those layers for UV-radiation from higher-up.
 UV-radiation indirectly has effects on air quality and life on ground level, but more on other aspects than gas.
Also positive, such as for the creation of Vitamine-D.
Because of the local effects and the relation to other air components therefore also for for O3-measurement at ground level a local measuring setup is required.
Information of RIVM bases on models & estimations, at surface level supported by info from a limited number of qualified measuring stations.
Nearest RIVM measuring stations with gas-info are in Eibergen and in Hellendoorn.
Actual status/ Remarks:


Actual read-out for Gas elements
The gauge for the Ozone-info from DarkSky has a scale from 0 till 600 Dobson Units.
The gauges for calibrated local gas-sensors for O3 en NO2 will have a scale from 0 till 300 µg/m3:
till translation to µg/m3 the ADC-signals from the sensors of MiCS6814 and Alphasense intially will be displayed on the same scale.
With the choosen settings for ADS1115: 1 unit = 1mV from the gassensor.
Ozone-info (stratosphere) from DarkSky [= calculated Dobson Units]
CO-info ground-level measurement [= ADC-values]
NO2-info ground-level measurement [= ADC-values]
NH3-info ground-level measurement [= ADC-values]
The colour classifcation for gas-related air quality is according to the table below.
For O3 and NO2 derived from the RIVM-table for Air Quality Index.
The Ozone-information from DarkSky and from NASA is an indication for the thickness of the ozone layer protecting the earth, not a local, atmospheric O3-measurement with indication in µg/m3.
In absence of local O3-measurements the info from DarkSky (as Dobson Units = DU) has been roughly (reversely) translated from the map colours of NASA:
'green'= thickest Ozone-layer = best protection, while 'red' = thinnest Ozone-layer = least protection (e.g. in 'Ozone-hole').
The selected classification for the ADC-signals is an arbitrary default, until more experience has been collected:
- for CO applying the O3-info of RIVM
- for NO2&NH3 'aligning' with the NO2-scaling of RIVM.
| Quality = Colour |
Good = Green |
Average = Blank |
Insufficient = Yellow |
Bad = Red
|
| Ozone [DU] |
600 ~ 450 |
450 ~ 350 |
350 ~ 200 |
200 ~ 0
|
O3 [µg/m3] /
ADC_CO [Units] |
0 ~ 40 |
40 ~ 100 |
100 ~ 180 |
> 180
|
NO2 [µg/m3] /
ADC_NO2_NH3 [Units] |
0 ~ 30/
0 ~ 60 |
30 ~ 75/
60 ~ 150 |
75 ~ 125/
150 ~ 250 |
> 125/
> 250
|
This site borrows dynamic prognosis for gas-oriented Air Quality from the RIVM-site to which this Meteo-System indirectly uploads data through Samenmeten_Dataportaal.
The prognosis for Ozone has a multi-day bracket around a selected (Dutch) postal code.


24Hour graphs
Graphs for gasses require a tested, operating measuring setup.
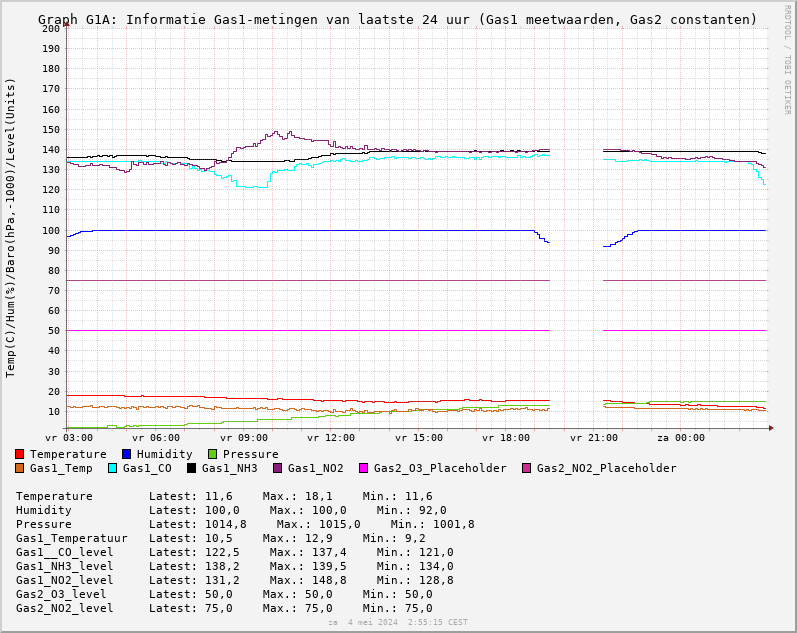
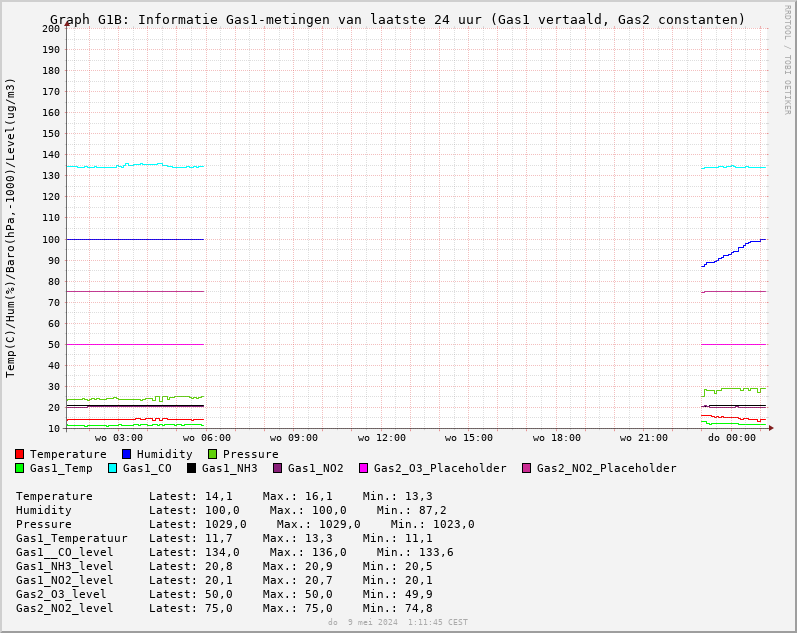
The 24hour-graphs below are experimental summaries of the MiCS6814 sensor's analogue values in a running window with periodic, online update.
 For fitting combinations the graphs G1A and G1B show:
# Temperature, Humidity and Pressure are real, measured values determined by the dust-related sensors.
- Temperatures, Humidity and Levels are 'as-is'
- Pressure is the difference relative to 1000hPa
# Gas1-implementation = measurement by MiCS6814 for 3 gas types
+ measurement by LM35 for 1 gas/air temperature
# Gas2-implementation = measurement assumed by 2 'peaked' sensors for 2 gas segments, such as from Alphasense.
Till real sensors arrive, 'placeholder'-constants.
The placeholder constants serve as reference lines in the graph.
 Graph G1A in this first edition has:
# Gas1-implementation = readout on dynamic data from ESP8266_GP2Y10 with ca. 1mV/Unit
Gas1-levels: gaslevels are raw ADC-values.
Gas1Temperature is a translation of the ADC-value to degrees Celsius.
Graph G1B experimentally translates the ADC-values for gasses into µg/m3,
coarsely aligning with RIVM's NO2-forecast
# Gas1-leveltranslation:
1 Unit ~ 0.15 µg/m3 for NO2&NH3
1 Unit ~ 1 µg/m3 for CO
 For comparison the dust-graph for the same 24hours.
The components in the Dust-graphs not always are singularly generated, but often 'combined'.


Longterm graphs
Longterm graphs for gasses only implemented after the 24Hour graphs are OK and calibrated.


Why local gas measuring for Air Quality?
Like for any meteo aspect also for gasses severe local deviations may occur.
National and regional info is nice, but therefore measurement of gasses must be included in the local setup:
high quality and high accuracy is not the first idea, because it requires related budgets .....
The budget aspect, calibration and reliability are obstacles for private application of high quality gas sensors.
Some local projects already get involved, but at this location it causes delay.


System Layout
As 'basic configuration' the 'simple' set with Dust sensor type GP2Y10 + meteosensor BME280 has as add-on the Gas-sensor MiCS6814 + Temp-sensor LM35 + ADC ADS1115 in the housing.
The present ESP8266 is able to control the additional sensors on it's I2C interface and with the interface software for the ADS1115.
This ESP8266 performs the first stage of scaling & correction of the data.
Domoticz is handling the follow-on data processing incl. handover to applications.
Progress/results for this setup described in a separate webpage.
The 'more accurate' set with Dust sensor type SDS011 + meteosensors BME280&DHT22 in the present housing probably has no space left to accomodate the Alphasense sensors and their interfaces:
investigation required how to configure, how to house and how to link.
Best in a setup which can be shared with organisations like Luftdaten.org or RIVM or Sensebox.de
The uncertainties require a plan of attack for the next phases.


Back to main Air Quality webpage
Back to page for Meteo
The websection for Experiments starts here
Sitemap/ Jumplist voor deze website, incl. links to english versions of pages

Copyright © 2013-2022 T4S
Samenvatting voor Rechten & Verantwoordelijkheden / Summary for Rights & Liabilities
 As start a basic configuration which is rather broadband, with gas sensors which in (limited) quality and (limited) sensitivity are compatible with the dust-sensor GP2Y10
 Next level with a 'better' configuration for more accurate and more 'deep'investigation of specific segments
 The processing of the sensorsignals anyway requires additional interfaces (incl. A/D-converters) as well as functions for calibration.

